Why Every Indoor Playground Needs Age & Space Strategy
In today’s competitive entertainment market, building a profitable indoor playground is no longer just about installing equipment. The most successful indoor playground projects are designed with a clear strategy that combines age segmentation and space planning.
Whether you are launching a compact indoor playground or a large-scale indoor playground combined with a trampoline park, your ability to allocate space based on age groups directly impacts:
- Customer experience
- Stay time
- Spending behavior
- Overall ROI
A well-designed indoor playground can generate stable long-term revenue, while a poorly planned indoor playground often struggles with low utilization and weak customer retention.
In this guide, we will show you exactly how to design an indoor playground for maximum ROI using real space and revenue comparisons.
Why Age Segmentation Is the Core of Indoor Playground Profitability
Every indoor playground serves multiple types of users. However, not all users generate the same value.
Table 1 — User Value by Age Group in Indoor Playground
| Age Group | Behavior in Indoor Playground | Revenue Contribution |
|---|---|---|
| 0–3 | Short play, parent陪同 | Low direct revenue |
| 3–5 | High interaction | Medium revenue |
| 5–12 | Core users | High revenue |
| 12–18 | Social & competitive | High per capita spend |
| 18+ | Support consumption (F&B/events) | Indirect revenue |
Key takeaway:
A successful indoor playground focuses on 5–12 years as the core, while using other age groups to increase total spending.
Space Planning: The Hidden Driver of Indoor Playground ROI
Space is one of the biggest investments in any indoor playground. Every square meter must generate revenue.
Golden Rule:
The more age groups your indoor playground serves, the higher your revenue potential — but only if space is allocated correctly.
Recommended Space Allocation for Indoor Playground
Table 2 — Ideal Space Ratio for Indoor Playground
| Zone | % of Indoor Playground | Purpose |
|---|---|---|
| Toddler Zone | 10–15% | Safety + parent trust |
| Preschool Zone | 20% | Exploration |
| Main Play Zone (5–12) | 40–50% | Core revenue |
| Teen / Trampoline Park | 20–30% | High-value users |
| Lounge / F&B | 10–15% | Secondary spending |
A balanced indoor playground layout ensures that no space is wasted and each area contributes to ROI.
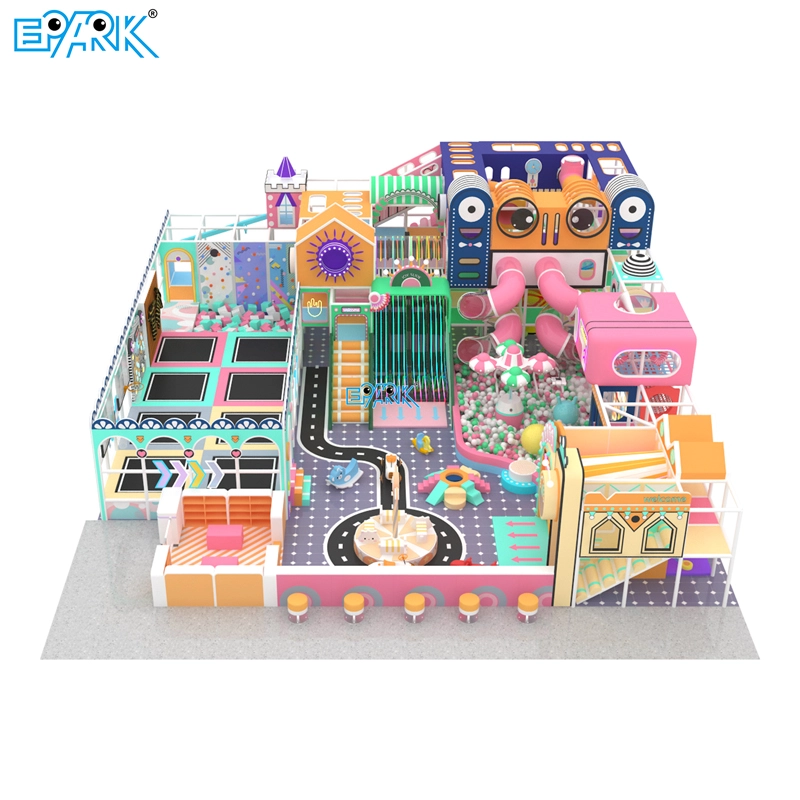
Case Study: 100 m² Indoor Playground (0–10 Years)
A small indoor playground is ideal for:
- Shopping malls
- Daycare centers
- Community spaces
Layout of a 100 m² Indoor Playground
Table 3 — 100 m² Indoor Playground Layout
| Area | Function | Age Group |
|---|---|---|
| 25 m² | Soft play | 0–3 |
| 30 m² | Interactive zone | 3–5 |
| 30 m² | Mini obstacle play | 5–10 |
| 15 m² | Seating | Parents |
Revenue Model for Small Indoor Playground
Table 4 — 100 m² Indoor Playground Revenue
| Item | Calculation | Annual Revenue |
|---|---|---|
| Tickets | 40 visitors × $12 × 300 days | $144,000 |
| Parties | 4/month × $150 × 12 | $7,200 |
| Total | $151,200 |
ROI Analysis — Small Indoor Playground
| Metric | Value |
|---|---|
| Investment | $40,000–$60,000 |
| Operating Cost | ~$60,000 |
| Profit | ~$90,000 |
| ROI | ~150% |
Insight:
A small indoor playground has fast ROI, but limited growth potential.
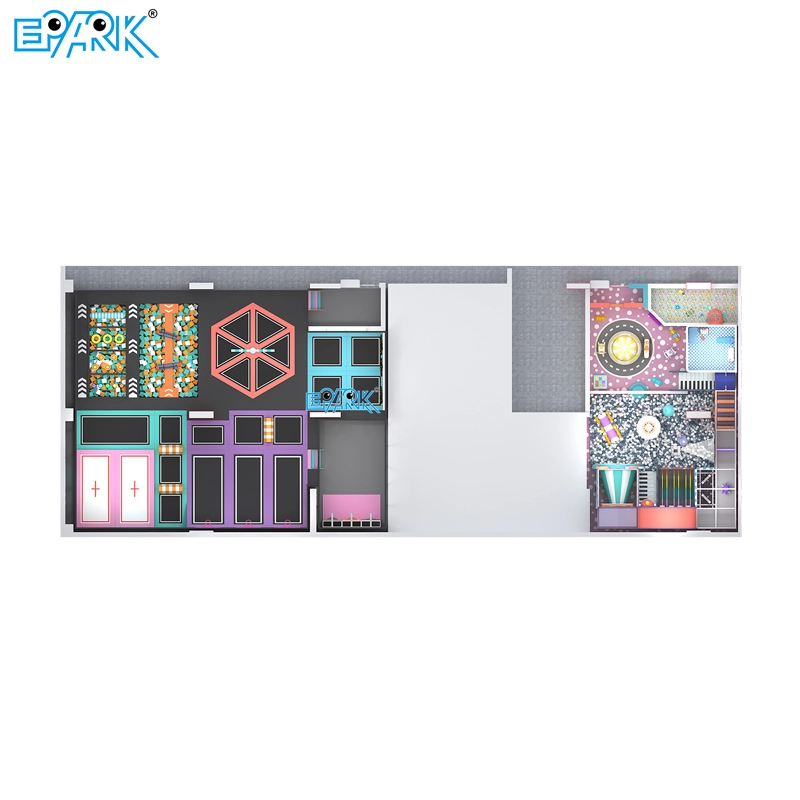
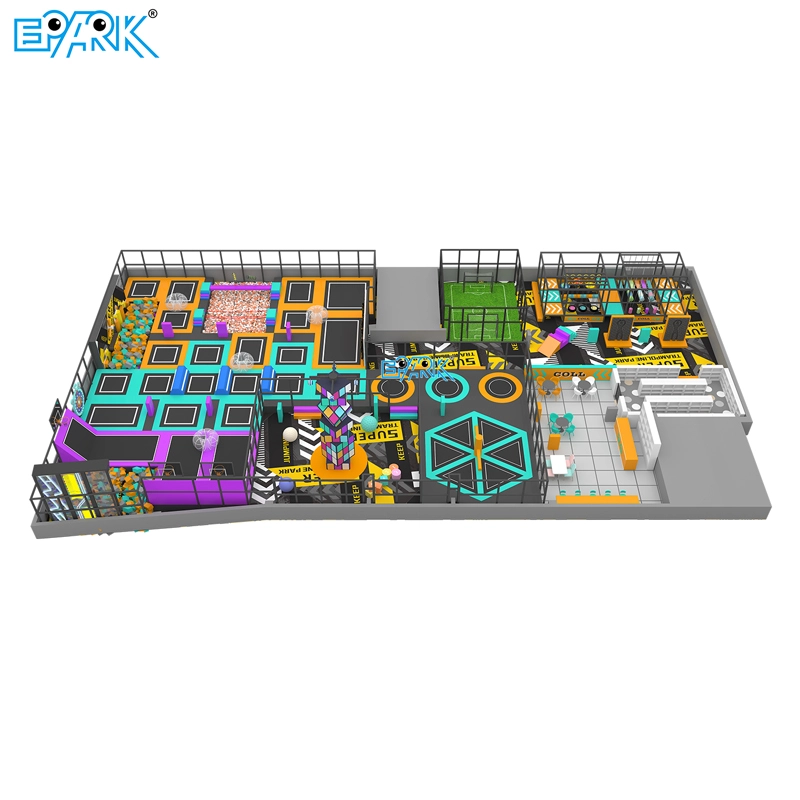
 Case Study: 1000 m² Indoor Playground + Trampoline Park
A large indoor playground combined with a trampoline park targets full age coverage (0–22) and maximizes revenue streams.
Layout of Large Indoor Playground
Table 5 — 1000 m² Indoor Playground Layout
| Area | Function | Age Group |
|---|---|---|
| 100 m² | Soft play | 0–3 |
| 150 m² | Preschool zone | 3–5 |
| 200 m² | Climbing & play | 5–12 |
| 300 m² | Trampoline park | 8–22 |
| 150 m² | VR & arcade | 10–22 |
| 100 m² | F&B | All |
Revenue Model — Large Indoor Playground
Table 6 — 1000 m² Indoor Playground Revenue
| Item | Calculation | Annual Revenue |
|---|---|---|
| Tickets | 220 × $18 × 300 days | $1,188,000 |
| Events | 15/month × $300 × 12 | $54,000 |
| F&B & Add-ons | $120,000 | |
| Total | $1,362,000 |
ROI Analysis — Large Indoor Playground
| Metric | Value |
|---|---|
| Investment | $500,000–$900,000 |
| Operating Cost | ~$400,000 |
| Profit | ~$962,000 |
| ROI | ~107% |
Small vs Large Indoor Playground — ROI Comparison
Table 7 — ROI Comparison
| Factor | 100 m² Indoor Playground | 1000 m² Indoor Playground |
|---|---|---|
| Target Age | 0–10 | 0–22 |
| Revenue Streams | Limited | Multiple |
| Customer Volume | Low | High |
| Profit | Medium | Very High |
| ROI Speed | Fast | Stable long-term |
Why Larger Indoor Playground Generates More Value
A large indoor playground creates multiple revenue engines:
Multi-age attraction
Families choose your indoor playground because everyone can play.
Longer stay time
More zones = longer visits = more spending.
Higher ticket price
A trampoline park inside your indoor playground justifies premium pricing.
Diversified income
- Tickets
- Events
- Food
- Membership
 How to Maximize ROI in Any Indoor Playground
For Small Indoor Playground
- Focus on 3–10 age group
- Increase visit frequency
- Offer party packages
For Large Indoor Playground
- Combine indoor playground + trampoline park
- Add high-value attractions
- Build membership systems
- Host events
Common Mistakes in Indoor Playground Planning
No age segmentation
Too much toddler space
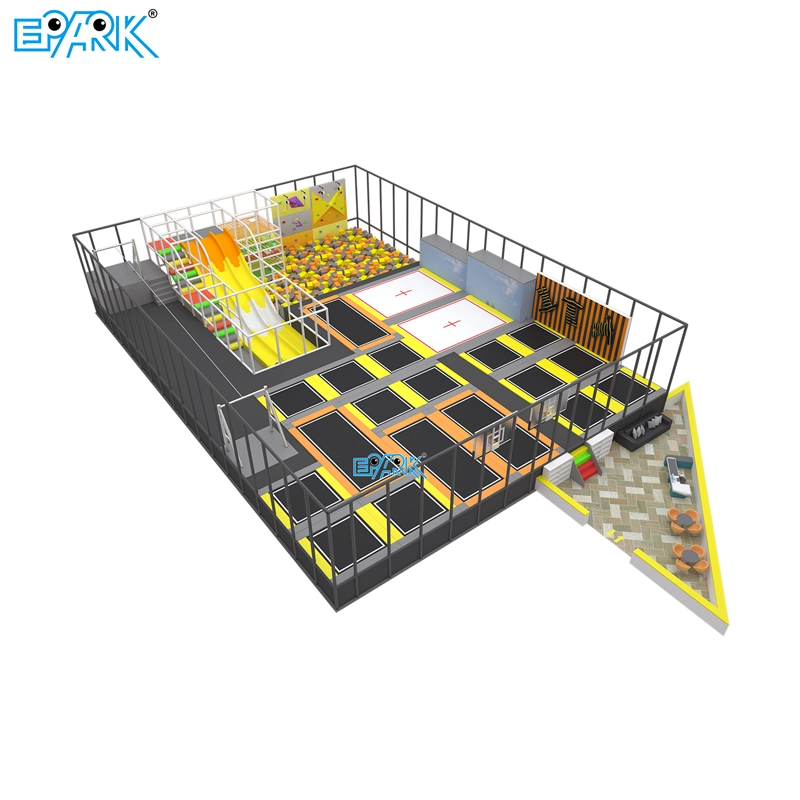
No teen attraction (missing trampoline park)
Poor traffic flow
These mistakes reduce indoor playground profitability.
Build an Indoor Playground That Prints ROI
A successful indoor playground is not just a play space — it is a profit system.
By combining:
Smart age segmentation
Scientific space allocation
Multi-zone design (including trampoline park)
Revenue diversification
You can transform your indoor playground into a high-performing business.
Call to Action
If you are planning to build an indoor playground or upgrade your indoor playground with a trampoline park:
We provide full layout design
ROI-based equipment solutions
Custom indoor playground manufacturing
Contact us today to get your indoor playground ROI plan